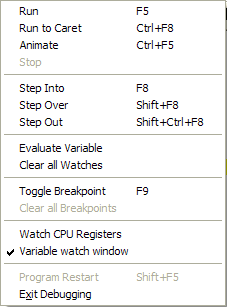
The Debug Menu provides the essential tools for debugging a PowerBASIC program. We will run through these in their order of appearance:

|
Run |
Begin running the program. It will continue to run until the debugger either encounters a breakpoint, or runs out of code to execute. F5 is the hot-key for the Run option. |
|
Run to Caret |
Begin running the program. It continues to run until the debugger either reaches the current line, or encounters a breakpoint, etc. CTRL+F8 is the hot-key for the Run to Caret option. |
|
Animate |
The debugger runs the program using an automated Step-Into technique. Execution continues until a breakpoint is reached, the Stop button is pressed, or the program completes. The Animate delay can be set through the IDE's Options Dialog. |
|
Stop |
Halt the debugger. If the debugger is already halted, this has no effect. CTRL+BREAK is the Stop hot-key. |
|
Step Into |
If the current line contains a call to a Sub, Function, Method, or Property, the debugger traces execution into that procedure. You cannot step into an API call, or into an external module. F8 is the Step Into hot-key. |
|
Step Over |
The debugger executes the current line of code. If the line contains a reference to a Sub, Function, Method, or Property, the debugger executes that code without tracing into the procedure. SHIFT+F8 is the Step Over hot-key. |
|
Step Out |
The debugger runs the code until the current Sub, Function, Method, or Property exits. If the current function is PBMAIN or WINMAIN, the code is executed until the program is finished or another breakpoint is encountered. CTRL+SHIFT+F8 is the Step Out hot-key. |
|
Evaluate Variable |
Evaluate or modify a variable, or add/remove a variable in the Watch window. It is not possible to use this to change the length of a string. Also see Watch CPU Registers. |
|
Clear all Watches |
Remove all variables from the Watch window. |
|
Toggle Breakpoint |
Set or release a breakpoint on the current line. F9 is the Toggle Breakpoint hot-key. |
|
Clear all Breakpoints |
Release all breakpoints in the program. |
|
Watch CPU registers |
Show or hide the Register Watcher window, which lets you see the state of the CPU registers and flags when debugging. |
|
Variable watch window |
Show or hide the Variable Watcher window, which lets you see the state of the ERR function and any variables you choose to watch when debugging. |
|
Program Reset |
If the current program is halted/stopped, the program will be reset, ready for debugging to commence again. SHIFT+F5 is the Reset hot-key. |
|
Exit Debugger |
Halts the current program and terminates the debugger. The variable list in the Watch window is retained between debugging sessions, until the IDE is closed. |
See Also
How the integrated debugger works